Fortezza Artifact Multi-Asset Growth Index: Recap After 6 Months
When we launched the Fortezza Artifact Multi-Asset Growth Index in January, our objective was to bring the logic behind Barudion’s Pro Portfolio into a cleaner, more investable format: an exchange-listed strategic certificate, issued with Fortezza Finanz AG and Vontobel, that follows the same regime-adaptive core process while reducing the frictions of manual replication. The public wrapper also gives us room to improve the strategy over time, including the addition of a broad commodities sleeve and the use of capital-efficient factor products.
At the three-month mark, the certificate had just begun to recover from a sharp March drawdown. Three months later, that recovery has continued, but the S&P 500 has rallied much faster. This update therefore intends to discuss this performance gap and explain what the portfolio’s increasingly defensive allocation is intended to achieve if today’s surprisingly resilient but still brittle, macroeconomic environment deteriorates.
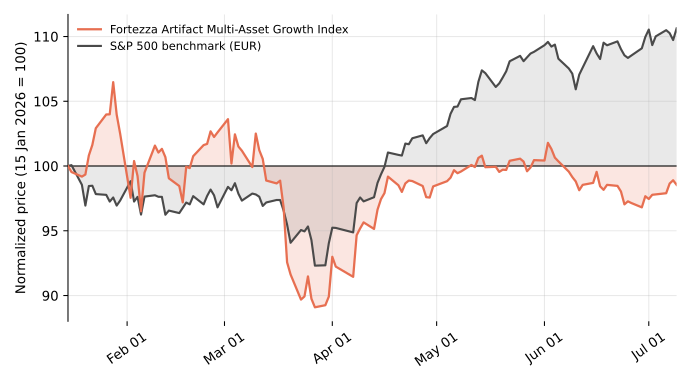 Figure 1: Since-launch performance of the certificate versus the S&P 500 benchmark. Both series are normalized to 100 on 15 January 2026, when active position management began. Chart based on daily Onvista Frankfurt closing prices in EUR through 9 July 2026.
Performance
The certificate started active position management on 15 January at EUR 99.00 and closed on 9 July at EUR 97.56, a return of -1.45%. Over the same dates, the EUR-denominated S&P 500 benchmark rose +10.63%. The resulting performance gap is -12.08 percentage points. Since our previous update, the certificate gained +3.03%, but it participated only partially in the recent risk-asset rally.
| Metric | Certificate | S&P 500 benchmark |
|---|---|---|
| Return since 15 Jan 2026 | -1.45% | +10.63% |
| Peak from launch | +6.47% | +10.63% |
| Max drawdown | -16.33% | -7.76% |
| Annualized volatility* | 20.68% | 12.46% |
| Trading days at or above benchmark** | 43 / 123 | — |
Table 1: Performance statistics since active management began.
* Annualized figures are based on a short live track record and should therefore be regarded as indicative rather than representative of long-term performance.
** Calculated using normalized series that include the first observation. Because this comparison begins on 15 January, it is not directly comparable with Vontobel’s since-issuance performance figure.
The allocation history explains why the certificate missed the risk-asset rally. After March, the strategy did not make a quick return to its original risk budget. Instead, it continued to reduce its 3x equity and gold sleeves, increased broad commodities, and raised cash and cash-like instruments toward 58%. That posture lowered participation in the strong equity rebound. The lag therefore is the realized cost of a model that saw continued regime uncertainty and stayed cautious while the benchmark rallied. However, with an on-going conflict in Iran that affects energy supply chains, this caution may be justified going forward.
A resilient economy with brittle edges
The U.S. economy continues to grow, but the balance between growth and inflation remains uncomfortable. The Bureau of Economic Analysis estimates that real GDP grew at a 2.1% annualized rate in the first quarter, while real final sales to private domestic purchasers rose only 1.7% and consumer spending was revised down. At the same time, headline CPI reached 4.2% year over year in May, driven in large part by energy, while core CPI stood at 2.9%. The Federal Reserve’s June projections accordingly raised expected 2026 PCE inflation from 2.7% to 3.6% and reduced projected real GDP growth from 2.4% to 2.2%. This is not a recessionary picture, but it leaves the economy more vulnerable to another shock and gives monetary policy less room to cushion one.
The most immediate risk comes from the conflict with Iran and the Strait of Hormuz. The IMF’s July outlook assumes that the Strait begins reopening in mid-July and broadly returns to pre-war conditions by March 2027. However, that path has become more uncertain following the latest escalation: on 7 July, three commercial ships were attacked in the Strait, prompting renewed U.S. strikes on Iran; Iran then retaliated against Kuwait and Qatar as mediators tried to preserve the interim agreement (Associated Press). These attacks do not mean that reopening will necessarily fail, but they could delay it and renew pressure on energy supplies, commodity prices, and inflation.
Allocation changes: more cash and commodities
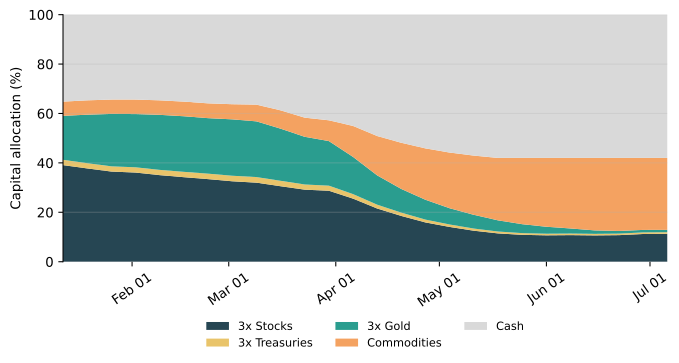 Figure 2: Model capital allocation since launch. The chart shows capital weights, not factor-adjusted notional exposure. Weekly observations run through 6 July 2026.
| Asset | 12 Jan 2026 | 6 Apr 2026 | 6 Jul 2026 | Change since launch |
|---|---|---|---|---|
| 3x Stocks | 39.1% | 25.5% | 11.3% | -27.8 pp |
| 3x Treasuries | 2.1% | 1.8% | 0.6% | -1.5 pp |
| 3x Gold | 17.8% | 15.1% | 0.9% | -16.9 pp |
| Commodities | 5.8% | 12.5% | 29.1% | +23.4 pp |
| Cash | 35.2% | 45.0% | 58.0% | +22.8 pp |
Table 2: Portfolio weights at launch, at the previous recap, and currently. Values may not sum to 100% due to rounding. In the live index, much of the “cash” allocation is implemented through overnight-rate ETFs rather than idle bank cash; current holdings are available on the Vontobel product page.
The cash allocation serves three purposes. It reduces the capital exposed to abrupt market moves, preserves liquidity for re-entry when the model sees a more coherent regime, and lowers the depth of loss from which the portfolio would have to compound back. Cash is not exciting during a rally, but optionality has value precisely because the next opportunity does not arrive on a known schedule. Berkshire Hathaway, for example, currently also maintains a very large cash reserve: its first-quarter filing reports approximately $397.4 billion in cash, cash equivalents, and short-term U.S. Treasury bills at 31 March.
The commodity allocation plays a different role. A diversified commodity sleeve can respond more directly than stocks or nominal bonds to shortages in energy, metals, agricultural inputs, or transport capacity. Historically, diversified commodity futures have shown positive sensitivity to inflation surprises, although that relationship is neither stable nor guaranteed over long horizons. In the present episode, the World Bank’s April Commodity Markets Outlook projected a 16% increase in broad commodity prices in 2026, led by energy and fertilizer.
How a large cash position can still participate
Holding 58% in cash and cash-like instruments does not mean that only 42% of the portfolio can influence returns. The equity, Treasury, and gold sleeves use 3x daily factor products. At the 6 July model weights, an 11.3% allocation to the 3x equity sleeve represents about 33.9% of daily equity exposure. Applying the same illustrative calculation to the smaller Treasury and gold sleeves, then adding the unlevered commodity position, produces roughly 67.8% factor-adjusted daily market exposure while only 42.0% of capital is outside cash.
This is the capital-efficiency advantage: the strategy can keep a substantial liquidity reserve while retaining meaningful participation in equities and real assets. It also limits the capital directly committed to each leveraged sleeve. For example, if the current equity factor product were to lose its entire value, the direct portfolio loss from that sleeve would be approximately its 11.3% capital weight, not its 33.9% daily notional exposure. That is a useful way to budget risk across sleeves.
The strategy does not need to call the exact market top for the cash reserve to have value. Its purpose is to preserve the ability to take risk later, when the model’s evidence becomes more coherent. Conversely, cash should not become a permanent refuge: if inflation and supply risks fade while growth remains healthy, the model will quickly rebuild equity exposure.
Past performance is not a reliable indicator of future results. This article is for information only and is not investment advice. The strategic certificate has no capital protection and is subject to market and issuer risk.
Related posts
Fortezza Artifact Multi-Asset Growth Index: Recap After 3 Months
Three months after launch, our strategic certificate has faced a difficult macro environment marked by tariff volatility, an Iran-driven energy shock, and renewed regime uncertainty — while our adaptive allocation process has responded by de-risking, broadening diversification, and preserving optionality.
2025 Recap: One Year of Live Trading
A full-year live trading recap of Barudion's Basic and Pro portfolios in 2025, benchmarked against the S&P 500 (EUR total return), including allocation changes and simulation-vs-live performance.
Probabilistic alpha and beta: quantifying an uncertain edge
In finance, the performance of an asset is often quantified by alpha (the excess returns above a benchmark return) and beta (the volatility or risk of the asset relative to a benchmark). These metrics are estimated from historical data and are often based on only short track records. Even if a long series of historical returns is available for an asset, older data may no longer represent the current market dynamics due to regime switches. In this post, we develop time-varying, probabilistic versions of alpha and beta, and go through the process of using these new metrics to build a dynamic stocks/bonds portfolio to improve on the classic 60/40 portfolio. To accomplish this, we employ probabilistic programming, a technique to build probabilistic models with ease in Python and infer parameters from noisy data.